CBA SALES OVERVIEW &
FULL RESEARCH REPORT
Washington Commercial Property Sales Finish Strong, up 43% Year Over Year. Multifamily Continues to Drive the Recovery
Commercial Brokers Association
2025 Year End Washington Commercial Property Sales Analysis
CBA’s Commercial Market Analysis (CMA) Sales Report analyzes yearly and quarterly economic and commercial real estate sales activity and trends at the market and submarket levels. This year-end report provides a comprehensive look at Washington’s 2025 commercial property sales market compared to 2024.
Key 2025 Year End Highlights
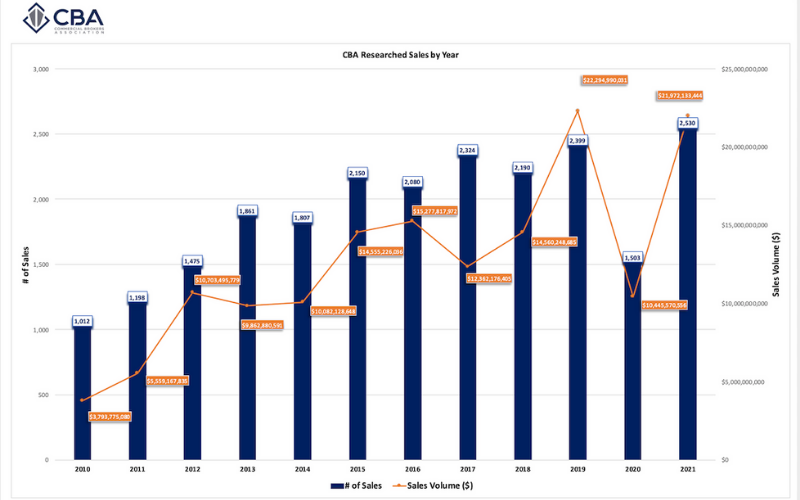
The Washington commercial property sales market continued its recovery throughout 2025, finishing the year with strong gains in both sales volume and transaction counts compared to 2024.
- Total 2025 sales volume increased approximately 43% year-over-year
- Total number of sales increased 11% year-over-year
- 2025 marked the strongest full year of sales activity since 2022, with momentum accelerating in the second half of the year
Multifamily posted the strongest year-over-year gains in both sales velocity and volume. Total volume dollar growth exceeded 60% year-over-year and transaction counts were up 35%, making multifamily the clear driver of overall market improvement. Industrial/Flex showed a strong rebound from 2024, up 49% year-over-year in volume and 19% in number of sales. Retail and Office sales were more modest, but the small gains show some possible stability. Land volume was at the bottom of all asset classes but showed a gain of 35% in volume compared to 2024.
Asset Class Year End Sales Volume Rankings (2025 vs 2024)
| Rank | 2025 | 2024 |
| 1 | Multifamily ($7.05b) | Multifamily ($4.2b) |
| 2 | Ind/Flex ($2.68b) | Ind/Flex ($1.8b) |
| 3 | Retail ($1.7b) | Retail ($1.67b) |
| 4 | Office ($1.56b) | Office ($1.4b) |
| 5 | Land ($1.07b) | Land ($799m) |
Asset Class Trends (2025 vs. 2024)
| Asset Class | Number of Sales | Sales Volume |
| Office | + 4% | + 11% |
| Retail | + 1% | + 4% |
| Industrial/Flex | + 19% | + 49% |
| Land | + 8% | + 35% |
| Multifamily | + 35% | + 68% |
County Trends (2025 vs. 2024)
| County | Number of Sales | Sales Volume |
| King | + 17% | + 37% |
| Snohomish | + 13% | + 40% |
| Pierce | + 1% | + 57% |
| Spokane | + 2% | + 39% |
| Kitsap | - 2% | + 85% |
| Thurston | + 7% | + 69% |
| Whatcom | + 16% | + 119% |
| Skagit | + 6% | + 9% |
| Benton | + 49% | + 75% |
DOWNLOADABLE REPORTS
CBA researches office, retail, industrial, multifamily (5+ units), and land sales, $250,000 or more, in Benton, King, Kitsap, Pierce, Skagit, Snohomish, Spokane, Thurston, and Whatcom counties. The raw data in our reports are pulled directly from the CBAcma database.
For questions about the report, please contact Binh Truong, VP of Market Data and Business Development, at binh@commercialmls.com or 425-952-2727.


ARCHIVED CBA SALES REPORTS
Reference previously archived CBA Sales Reports here: